Admission to the MD Undergraduate program is very competitive and each year there are more applicants than available seats in the incoming class. We encourage you to review these detailed statistics we collect each year and compare your profiles.
To be as transparent as possible about our admission decisions and results, we publish detailed statistics about who has been admitted to our MD Undergraduate Program.
Age, gender, prior academic institutions including high school, college or university and training completed before admittance to the program are all reported. Academic standings, including OGPA and AGPA of both accepted and refused applicants, can be found in our yearly reports and whether applicants were a BC resident or out-of-province.
Meeting the minimum admission requirements does not guarantee admission to the program and not all qualified applicants will be offered admission. However, qualified candidates who are not admitted are welcome to reapply in any subsequent year.
MED 2025 Admissions Statistics, Application Cycle 2020/2021
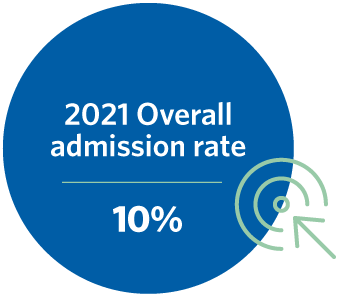
Admission Rate
2019 12% 288 accepted & enrolled 2,398 applicants
2020 11.3% 288 accepted & enrolled 2,558 applicants
2021 10% 288 accepted & enrolled 2,869 applicants
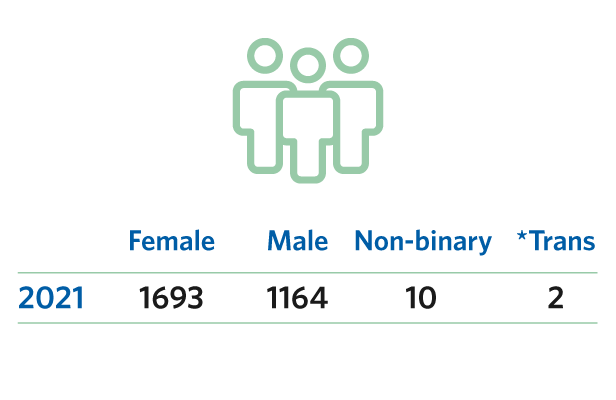
Applicants by Gender
2019 1,385 female 1,006 male 7 non-binary *Trans – new identification added in 2020.
2020 1,445 female 1,094 male 7 non-binary 2 trans*
2021 1,693 female 1,164 male 10 non-binary 2 trans*
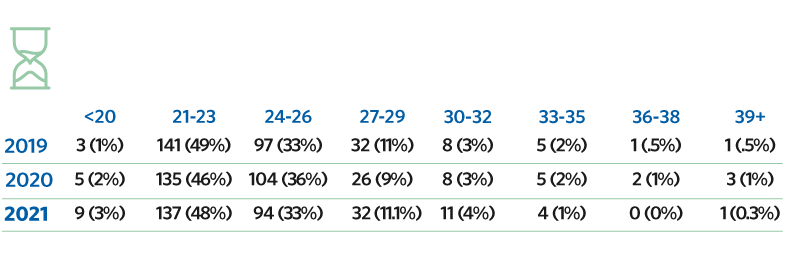
Age Distribution for Entering Class
Between 2019 – 2021, the largest age groups represented were 21 – 23 and 24 – 26 years of age. The mean age in 2021 was 24.10.
Average OGPA or AGPA for Entering Class
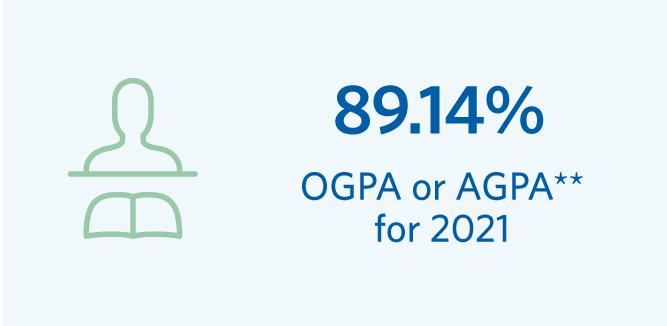
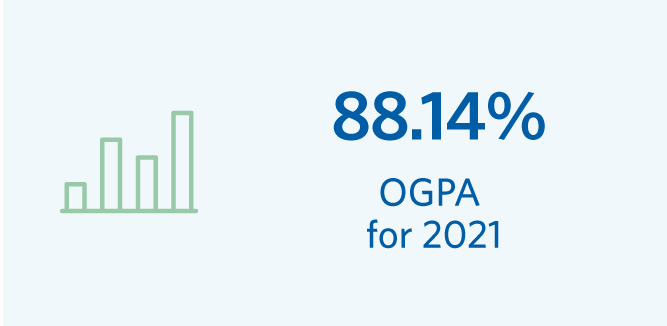
2019 88.62% OGPA or AGPA** 87.69% Overall
2020 89.29% OGPA or AGPA** 88.30% Overall
2021 89.14% OGPA or AGPA** 88.14% Overall
* GPAs are based on grades received at time of application ** AGPA used if applicable
MCAT Scores of the Entering Class
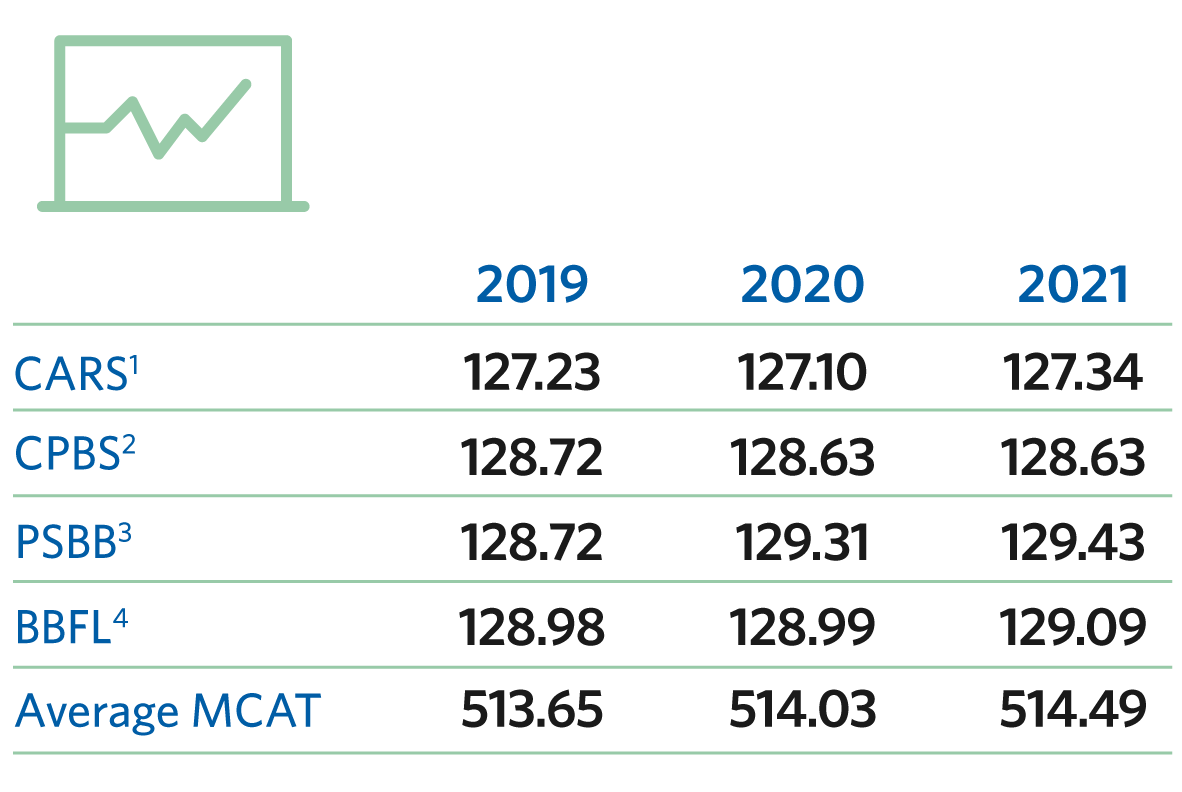
2019 MCAT Average 513.65
2020 MCAT Average 514.03
2021 MCAT Average 514.49
Past Admissions Statistics
- Interim Statistics of 2023/2024 Applicants (MED 2028)
- Interim Statistics of 2022/2023 Applicants (MED 2027)
- MED 2025 Admissions Statistics, application cycle 2020/2021 (pdf)
- MED 2024 Admissions Statistics, application cycle 2019/2020 (pdf)
- MED 2023 Admissions Statistics, application cycle 2018/2019 (pdf)
- MED 2022 Admissions Statistics, application cycle 2017/2018 (pdf)
- MED 2021 Admissions Statistics, application cycle 2016/2017 (pdf)
- MED 2020 Admissions Statistics, application cycle 2015/2016 (pdf)
- MED 2019 Admissions Statistics, application cycle 2014/2015 (pdf)
- MED 2018 Admissions Statistics, application cycle 2013/2014 (pdf)
- MED 2017 Admissions Statistics, application cycle 2012/2013 (pdf)
- MED 2016 Admissions Statistics, application cycle 2011/2012 (pdf)
- MED 2015 Admissions Statistics, application cycle 2010/2011 (pdf)
- MED 2014 Admissions Statistics, application cycle 2009-2010 (pdf)